Plot daily prevalence of a lineage by location
Source:R/plotPrevalenceOverTime.R
plotPrevalenceOverTime.RdPlots the daily prevalence of a PANGO lineage by location
plotPrevalenceOverTime(
  df,
  colorVar = "lineage",
  title = "Prevalence over time",
  labelDictionary = NULL
)
Arguments
- df
result of the call to getPrevalence
- colorVar
variable to used to color the line traces. `lineage` by default
- title
(optional) Title to add to the plot
- labelDictionary
(optional) a named list of values to replace in the plot legend.
Value
ggplot2 object
Examples
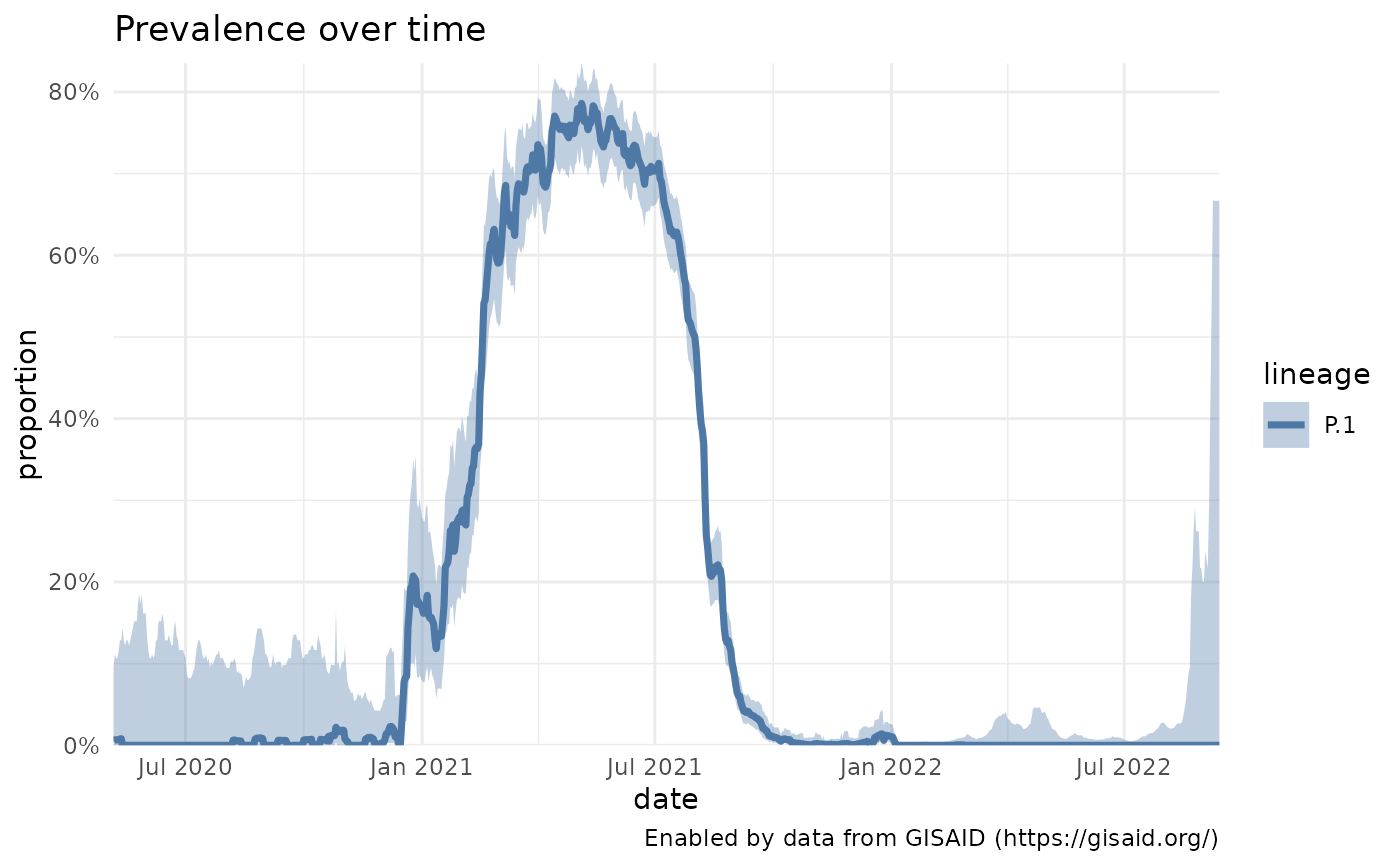
p1_brazil <- getPrevalence(pangolin_lineage = "P.1", location = "Brazil")
#> Retrieving data...
plotPrevalenceOverTime(p1_brazil)
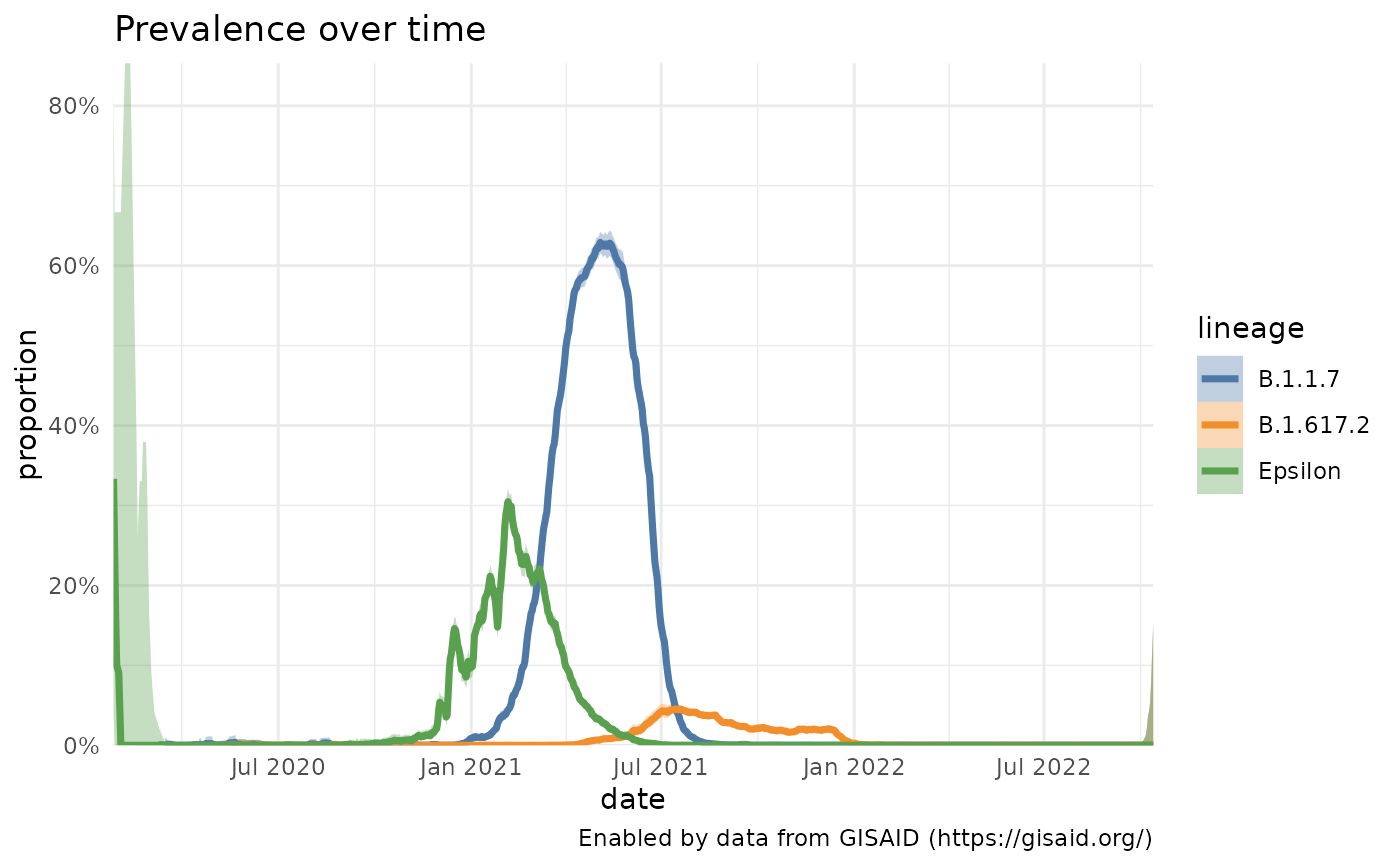
 us <- getPrevalence(pangolin_lineage = c("B.1.1.7", "B.1.427 OR B.1.429", "B.1.617.2"), location = "United States")
#> Retrieving data...
#> Retrieving data...
#> Retrieving data...
plotPrevalenceOverTime(us, labelDictionary = c("B.1.427 OR B.1.429" = "Epsilon"))
us <- getPrevalence(pangolin_lineage = c("B.1.1.7", "B.1.427 OR B.1.429", "B.1.617.2"), location = "United States")
#> Retrieving data...
#> Retrieving data...
#> Retrieving data...
plotPrevalenceOverTime(us, labelDictionary = c("B.1.427 OR B.1.429" = "Epsilon"))
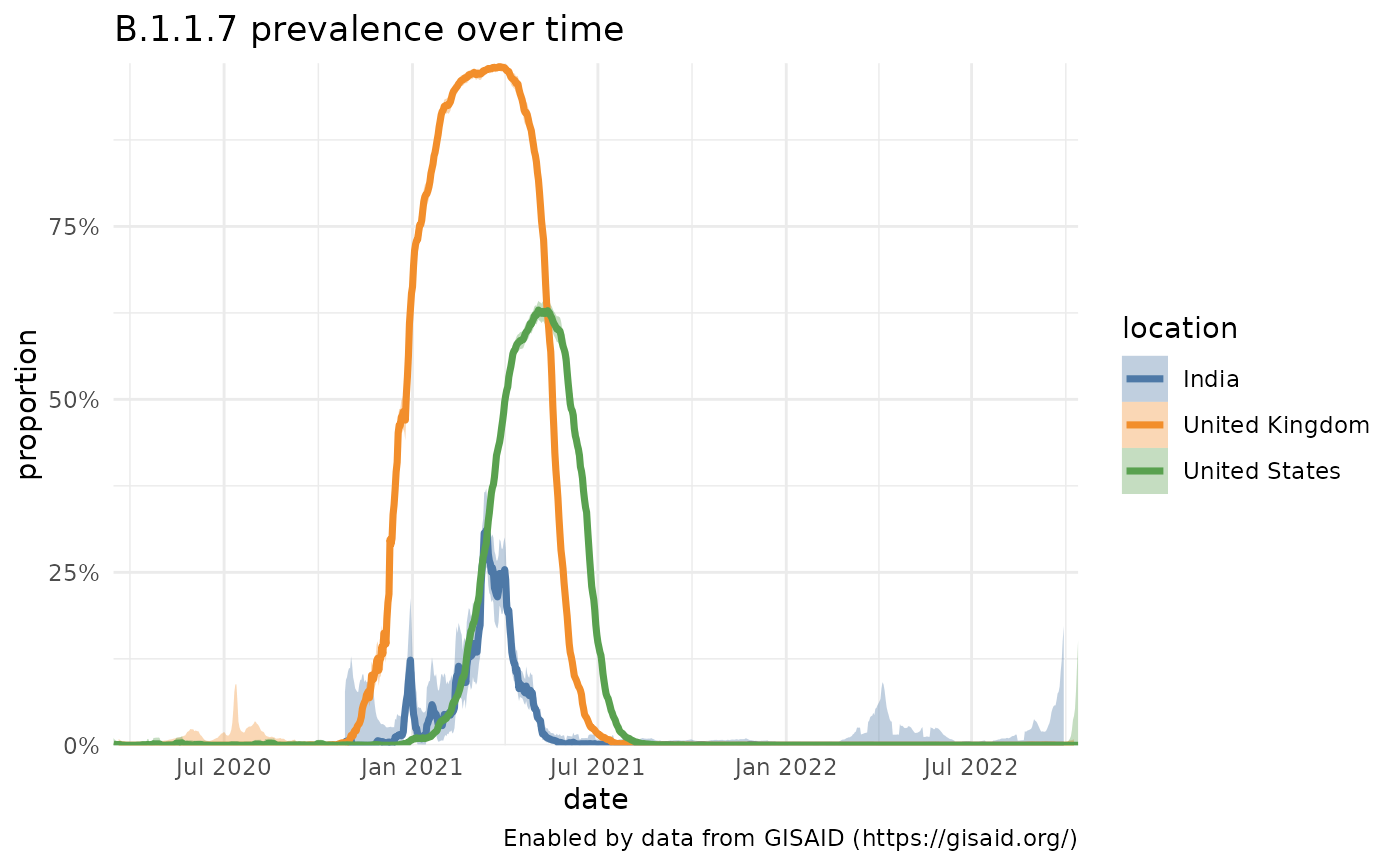
 # Overlay locations
b117_india = getPrevalence(pangolin_lineage = "B.1.1.7", location = "India")
#> Retrieving data...
b117_us = getPrevalence(pangolin_lineage = "B.1.1.7", location = "United States")
#> Retrieving data...
b117_uk = getPrevalence(pangolin_lineage = "B.1.1.7", location = "United Kingdom")
#> Retrieving data...
b117 = dplyr::bind_rows(b117_uk, b117_india, b117_us)
plotPrevalenceOverTime(b117, colorVar = "location", title="B.1.1.7 prevalence over time")
# Overlay locations
b117_india = getPrevalence(pangolin_lineage = "B.1.1.7", location = "India")
#> Retrieving data...
b117_us = getPrevalence(pangolin_lineage = "B.1.1.7", location = "United States")
#> Retrieving data...
b117_uk = getPrevalence(pangolin_lineage = "B.1.1.7", location = "United Kingdom")
#> Retrieving data...
b117 = dplyr::bind_rows(b117_uk, b117_india, b117_us)
plotPrevalenceOverTime(b117, colorVar = "location", title="B.1.1.7 prevalence over time")