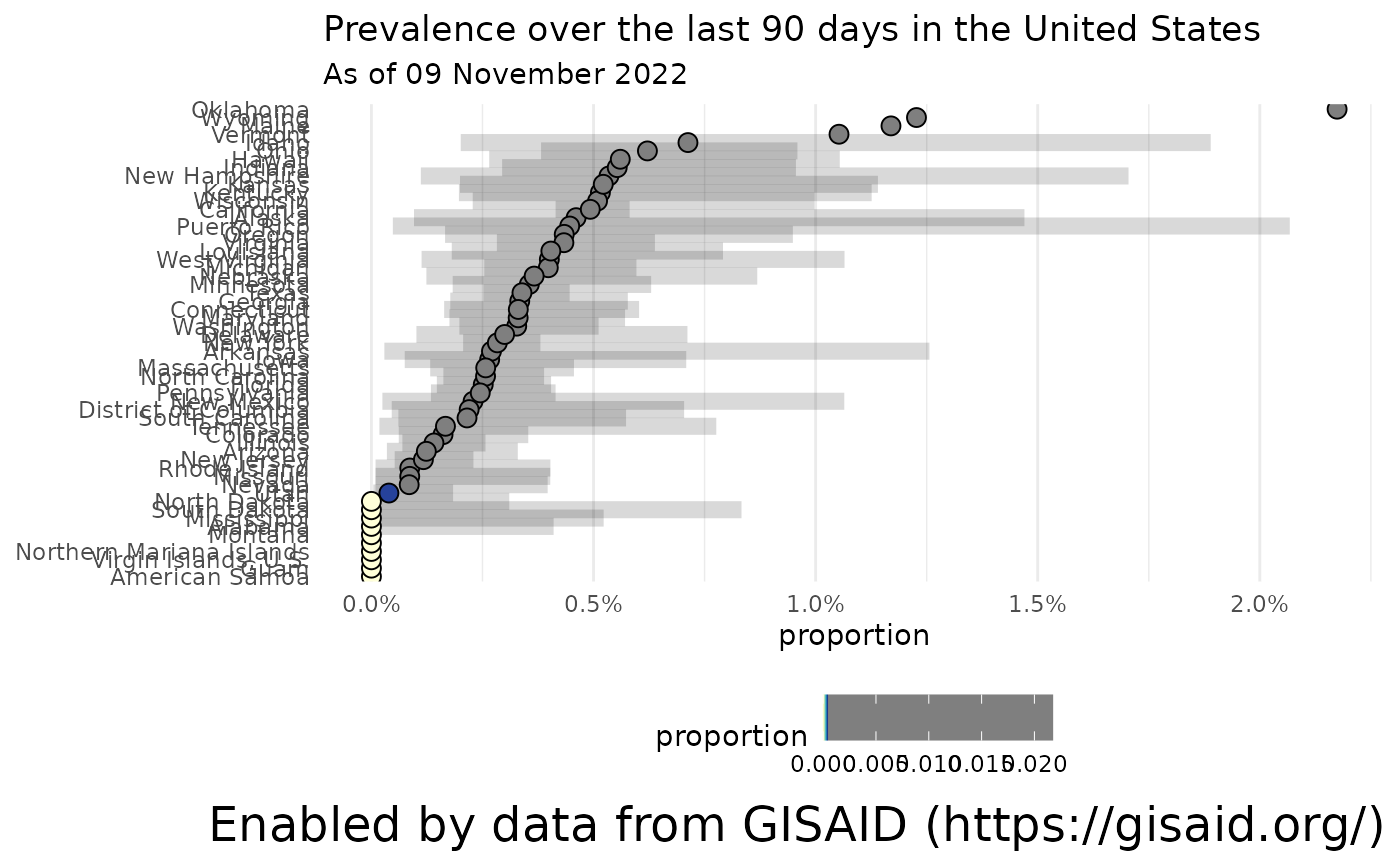
Plots a dot plot of prevalences of a variant in a specific location
Source:R/plotPrevalenceDotPlot.R
plotPrevalenceDotPlot.RdPlots a dot plot of prevalences of a variant in a specific location
plotPrevalenceDotPlot(df, title = NULL, subtitle = NULL, dot_size = 3)Arguments
- df
Dataframe resulting from calling getCumulativeBySubadmin
- title
(optional) Title to include on the plot
- subtitle
(optional) Subtitle to include on the plot
- dot_size
(optional) Dot plot size (in mm)
Value
Examples
# Calculate the proportion of sequences assigned to BA.2 or BA.2.12.1 by U.S. State
prev_by_state = getCumulativeBySubadmin(pangolin_lineage = c("BA.2", "BA.2.12.1"), location = "United States", ndays = 90)
#> Retrieving data...

# Plot the results
plotPrevalenceDotPlot(prev_by_state, "Prevalence over the last 90 days in the United States", subtitle = paste0("As of ", format(Sys.Date(), '%d %B %Y')))
#> Warning: Removed 10 rows containing missing values (`geom_segment()`).