Title Compare mutation prevalences between lineages
Source:R/plotMutationHeatmap.R
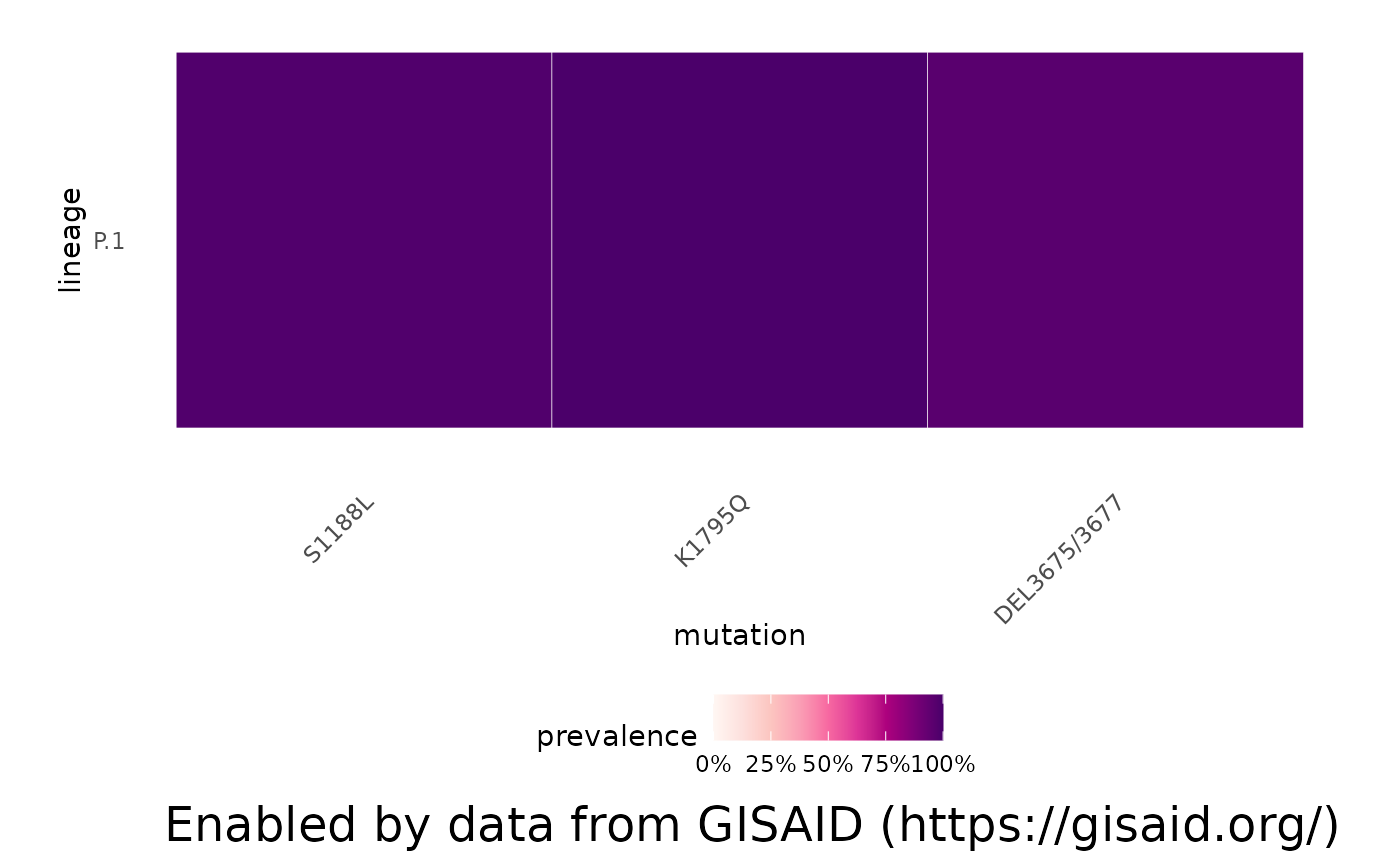
plotMutationHeatmap.RdPlots a heatamp of mutation prevalence across particular lineages.
plotMutationHeatmap(df, gene2Plot = "S", title = NULL, lightBorders = TRUE)Arguments
- df
Resulting dataframe from calling getMutationsByLineage
- gene2Plot
(optional) string containing which genes to include, e.g. "Orf1a" By default, will limit the mutations to those in the S-gene.
- title
(optional) title to add to the plot
- lightBorders
(optional) boolean; whether the borders between grid items should be separated with a light or dark border.
Value
Examples
p1 = getMutationsByLineage(pangolin_lineage = "P.1", frequency = 0.5)
#> Retrieving data...
plotMutationHeatmap(p1, gene2Plot = "ORF1a")